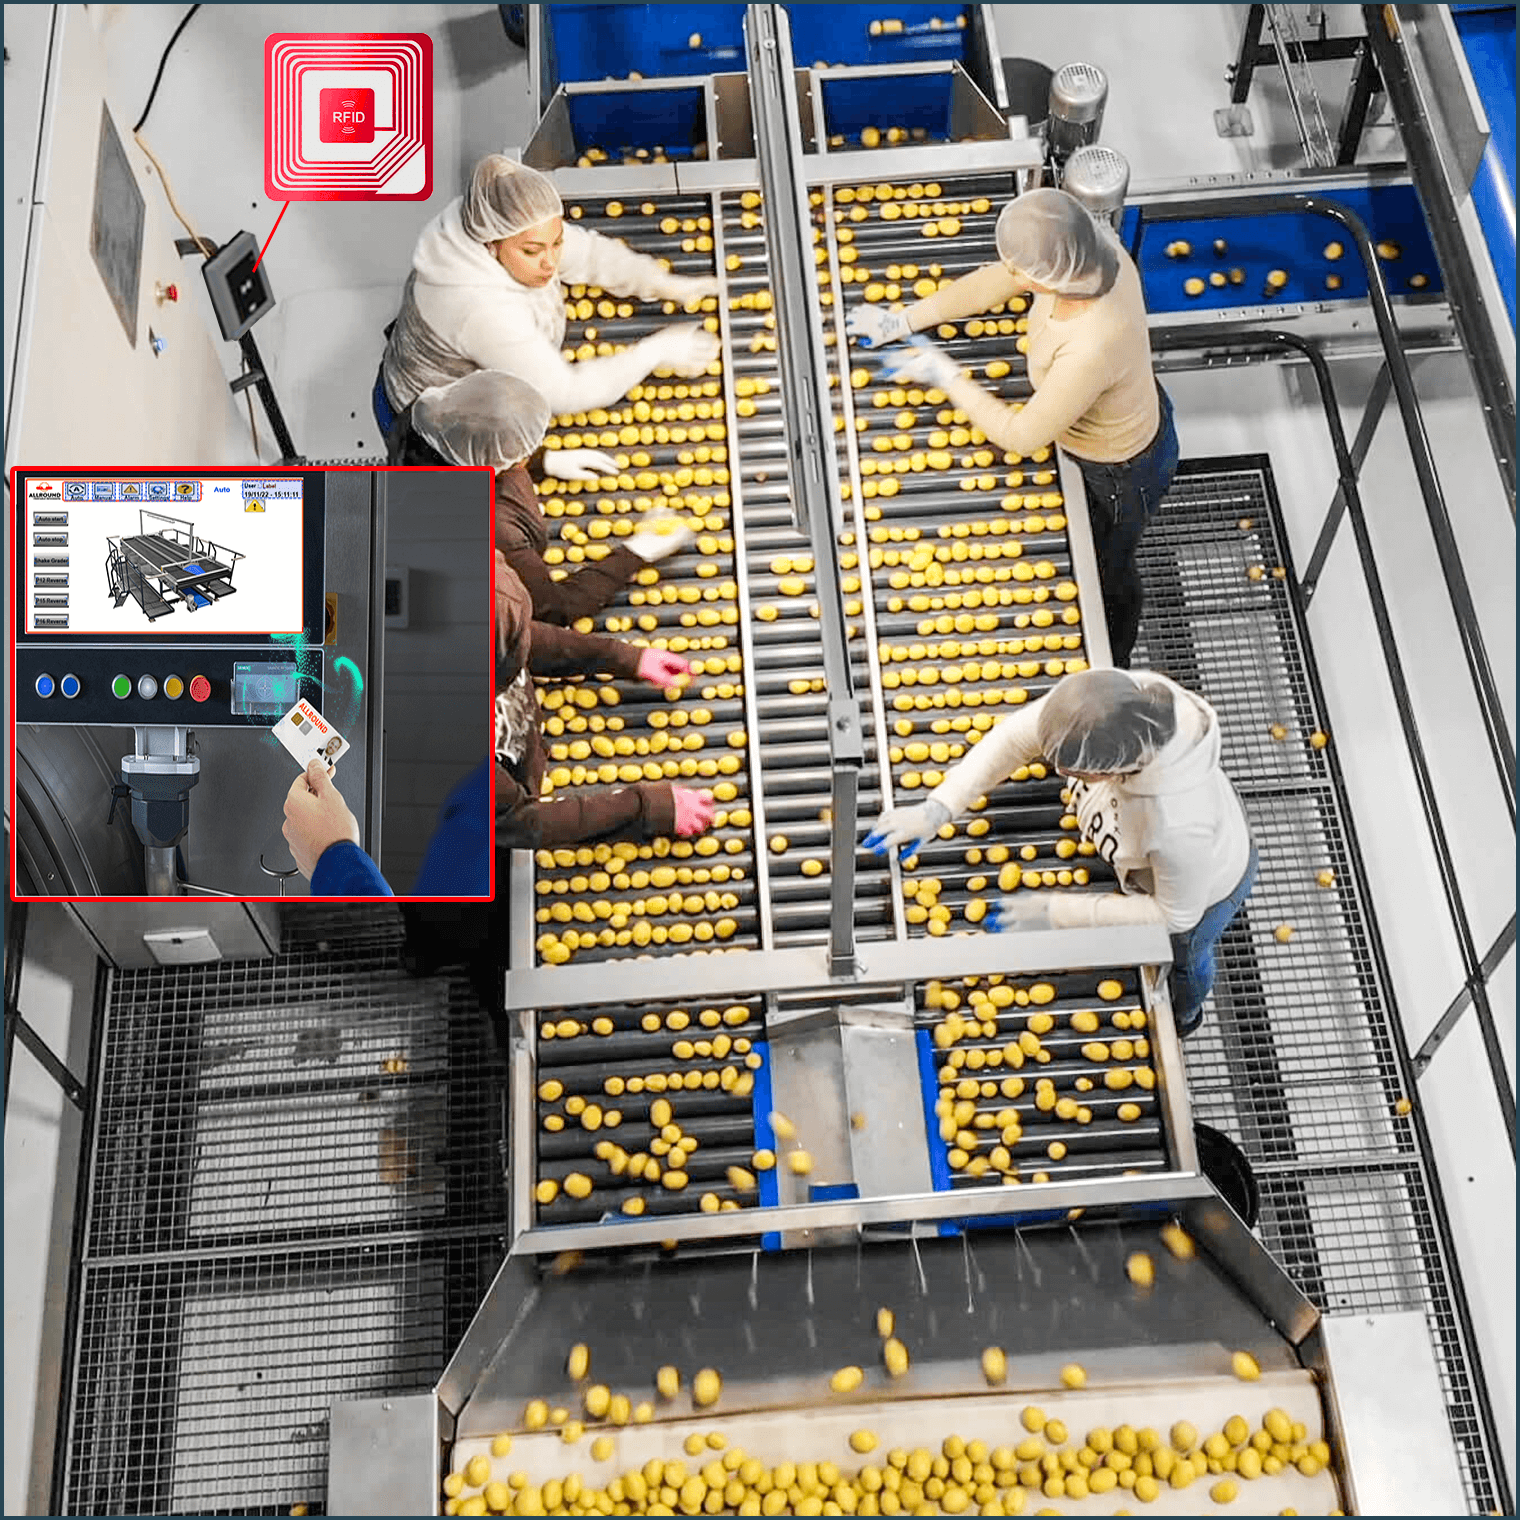
Calculations
In the Partnership of Companies we are suppliers of individual machines, complete lines and composite projects. For all these three categories we make the most careful calculations possible. In the agricultural sector, profit margins are often not very large. When comparing existing situations and improvements proposed by us, you often come to astonishingly short payback times. The conclusion is therefore often you have to be very rich to continue in the existing way. As a Partnership of Companies, we have qualified data analyst who calculates the projects on capacities and ROI in a dynamic calculation model for you. We discuss all assumptions and variables with you. However, the model is made in such a way that you can also change it yourself. This calculation model also includes the water consumption for a washing installation. For a daily monitoring of your business operations, we are working on a system to be able to follow every aspect of the line in real time. The data can be inserted into your ERP system to make the relevant comparisons from the history.
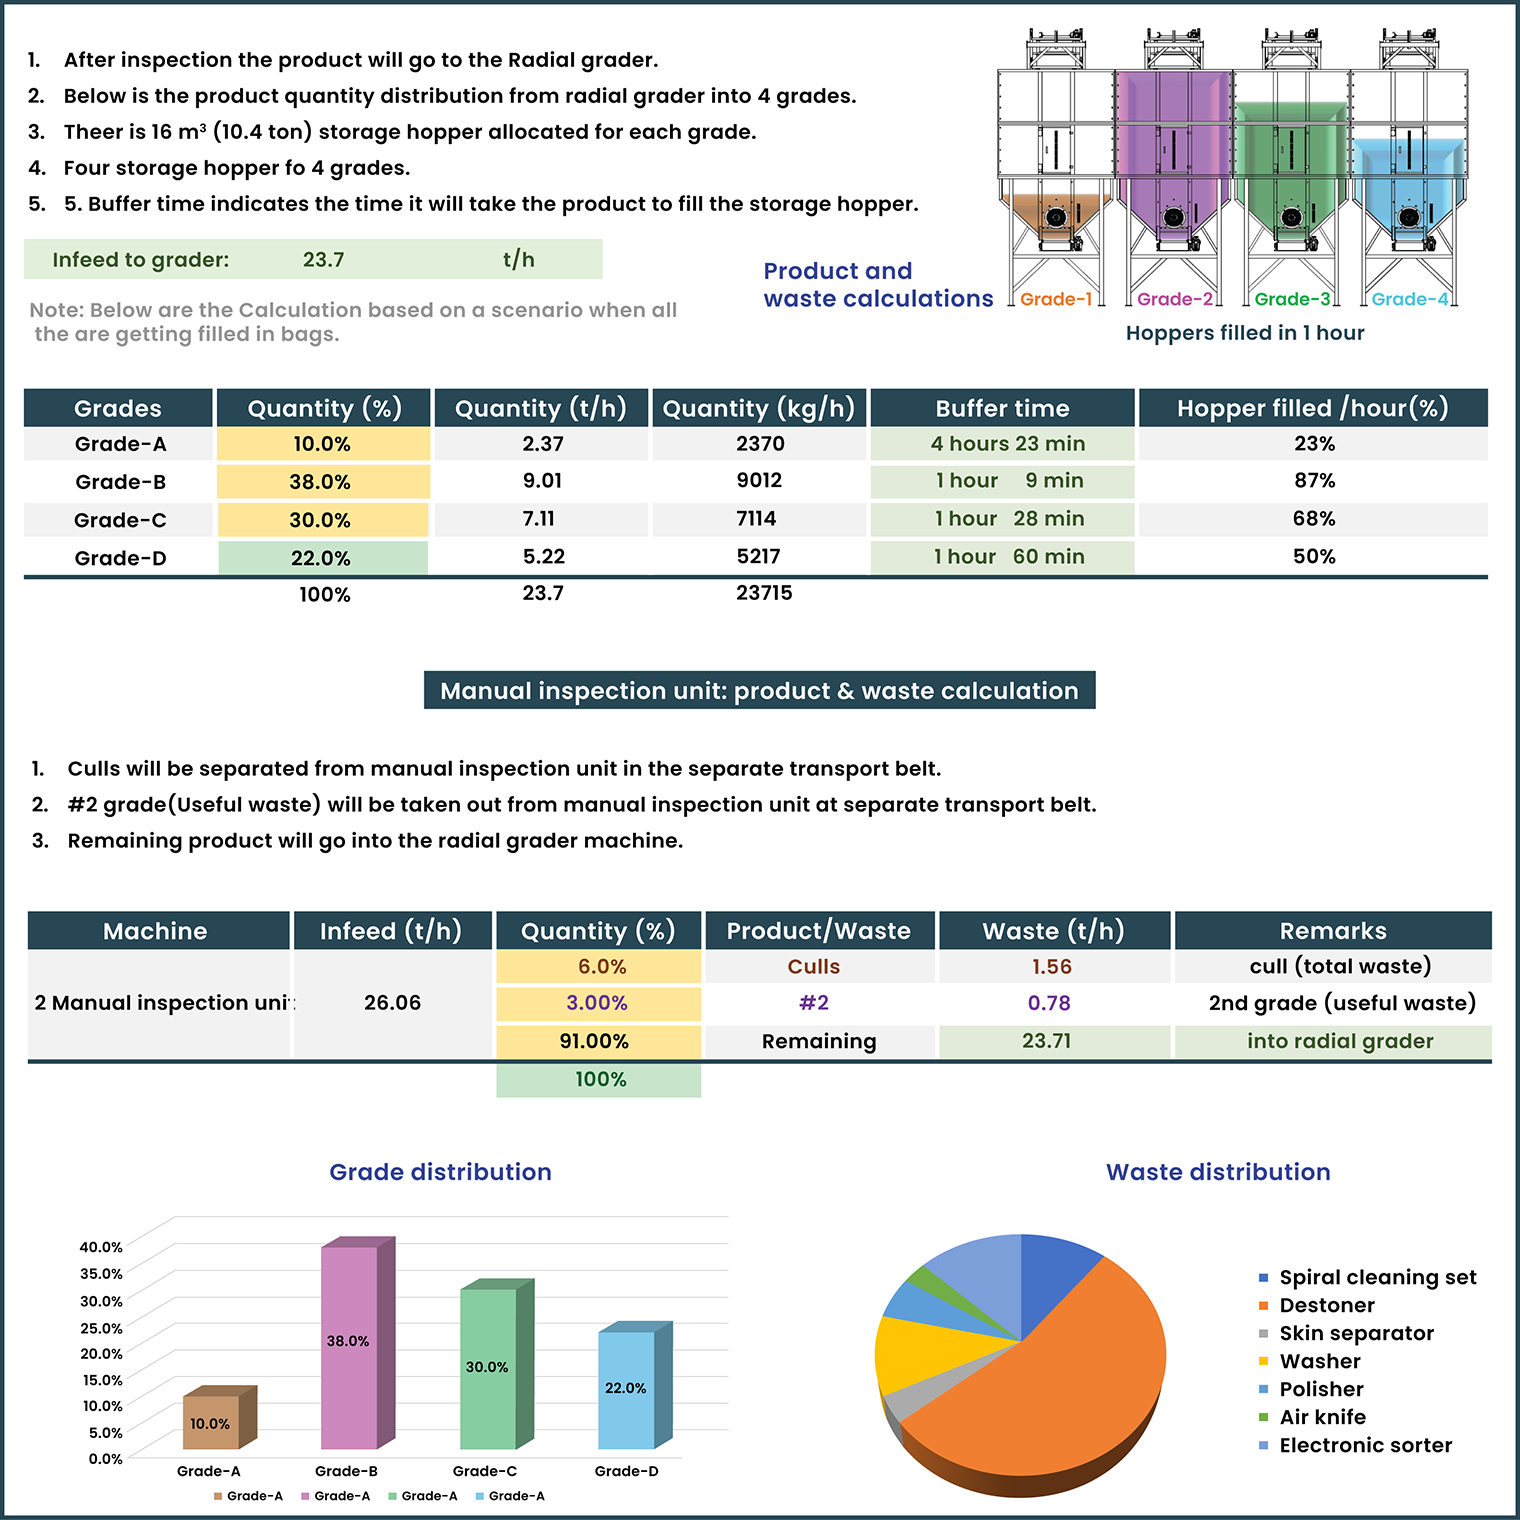
Product & waste flow chart
With the product and waste flow chart we show in a drawing what happens to the product from the input, processing, weighing and packaging, palletizing and collecting pallets. Your line/project is a dis-tribution center whether it is large or small. The batch (for example, carrots, potatoes and onions) changes composition at each machine in the line. We can measure and weigh everything from what is happening. For example, how much soil is sieved out at the receiving hopper. We make it clear in the schedule where any bottle necks occur. How much buffer should you keep between the input, pro-cessing, weighing and packaging and shipping. The product or waste streams that are important to you are presented very clearly in drawings, graphs and tables Which form of buffer, boxes or hoppers, is best for you. All these questions become clearer with the help of our dynamic calculation scheme.
ROI , payback and breakeven point
The most important questions about an investment remain:
What is the Return on Investment, what will I eventually earn with this investment.
Pay back time. How long does it take before I have earned back the investment.
Break even Point. At what occupancy rate, I’m out of the costs. There are, of course, more reasons that make a certain investment necessary.
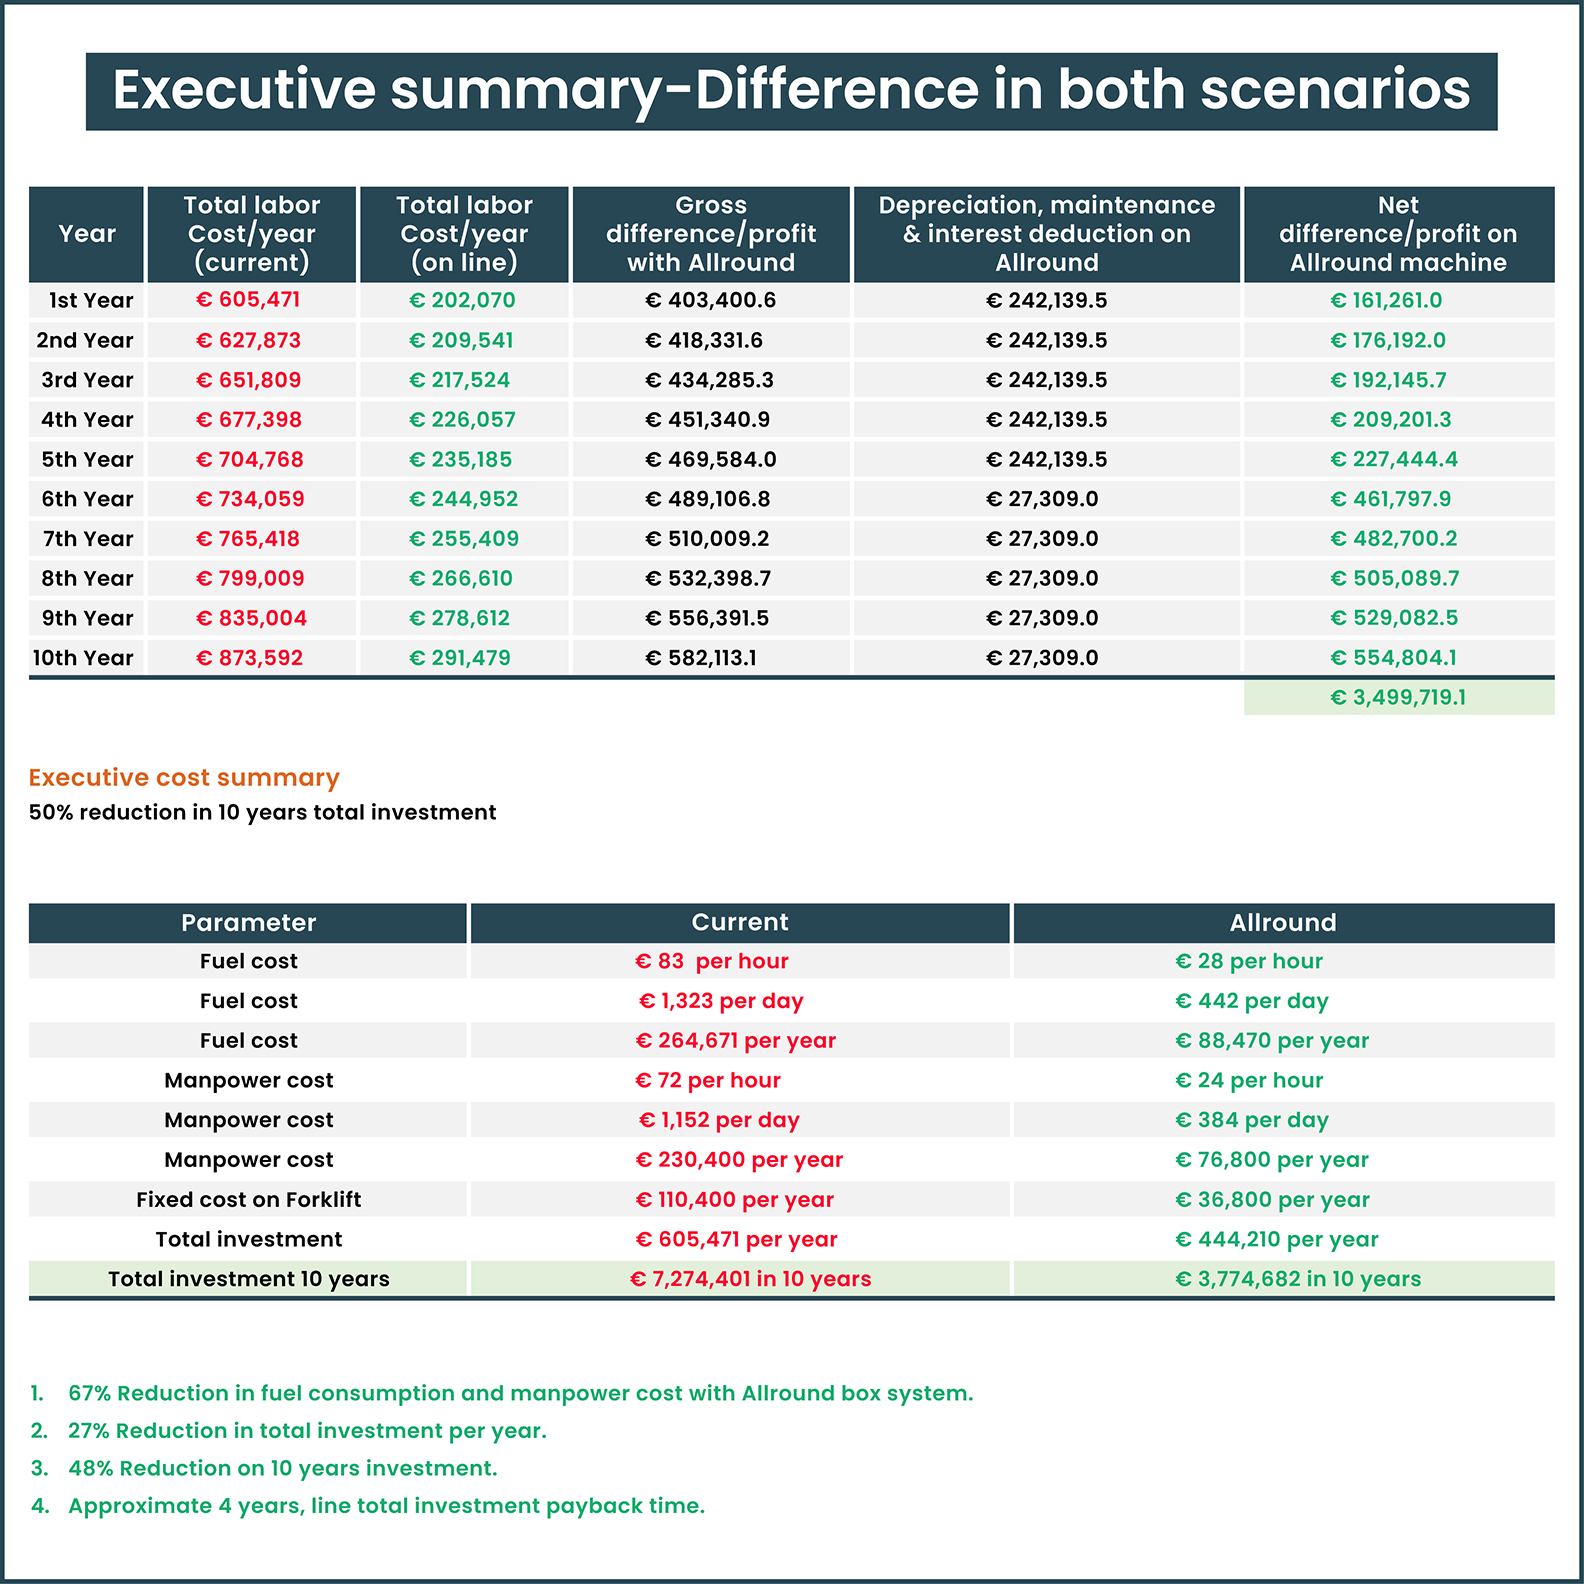
For example, a shortage of staff. Customer requirements regarding packaging. Better working conditions. However, when we come to shareholders, investors or the bank, the three points above will first have to be thoroughly substantiated. We have detailed calculation models for these three key figures. Our calculations are based on a depreciation period of five years. The technical life of a machine, line or installation is at least ten years. The calculation models are dynamic. This means that all variables can be filled in by you yourself. For example, wage costs per hour, with indexa-tion. Other important components in the cost calculation are: interest costs, depreciation of electricity tariff and consumption and maintenance costs. With our calculation, you can easily weigh up the feasibility of your investment together with your accountant.
Forklift, box and pallet movement
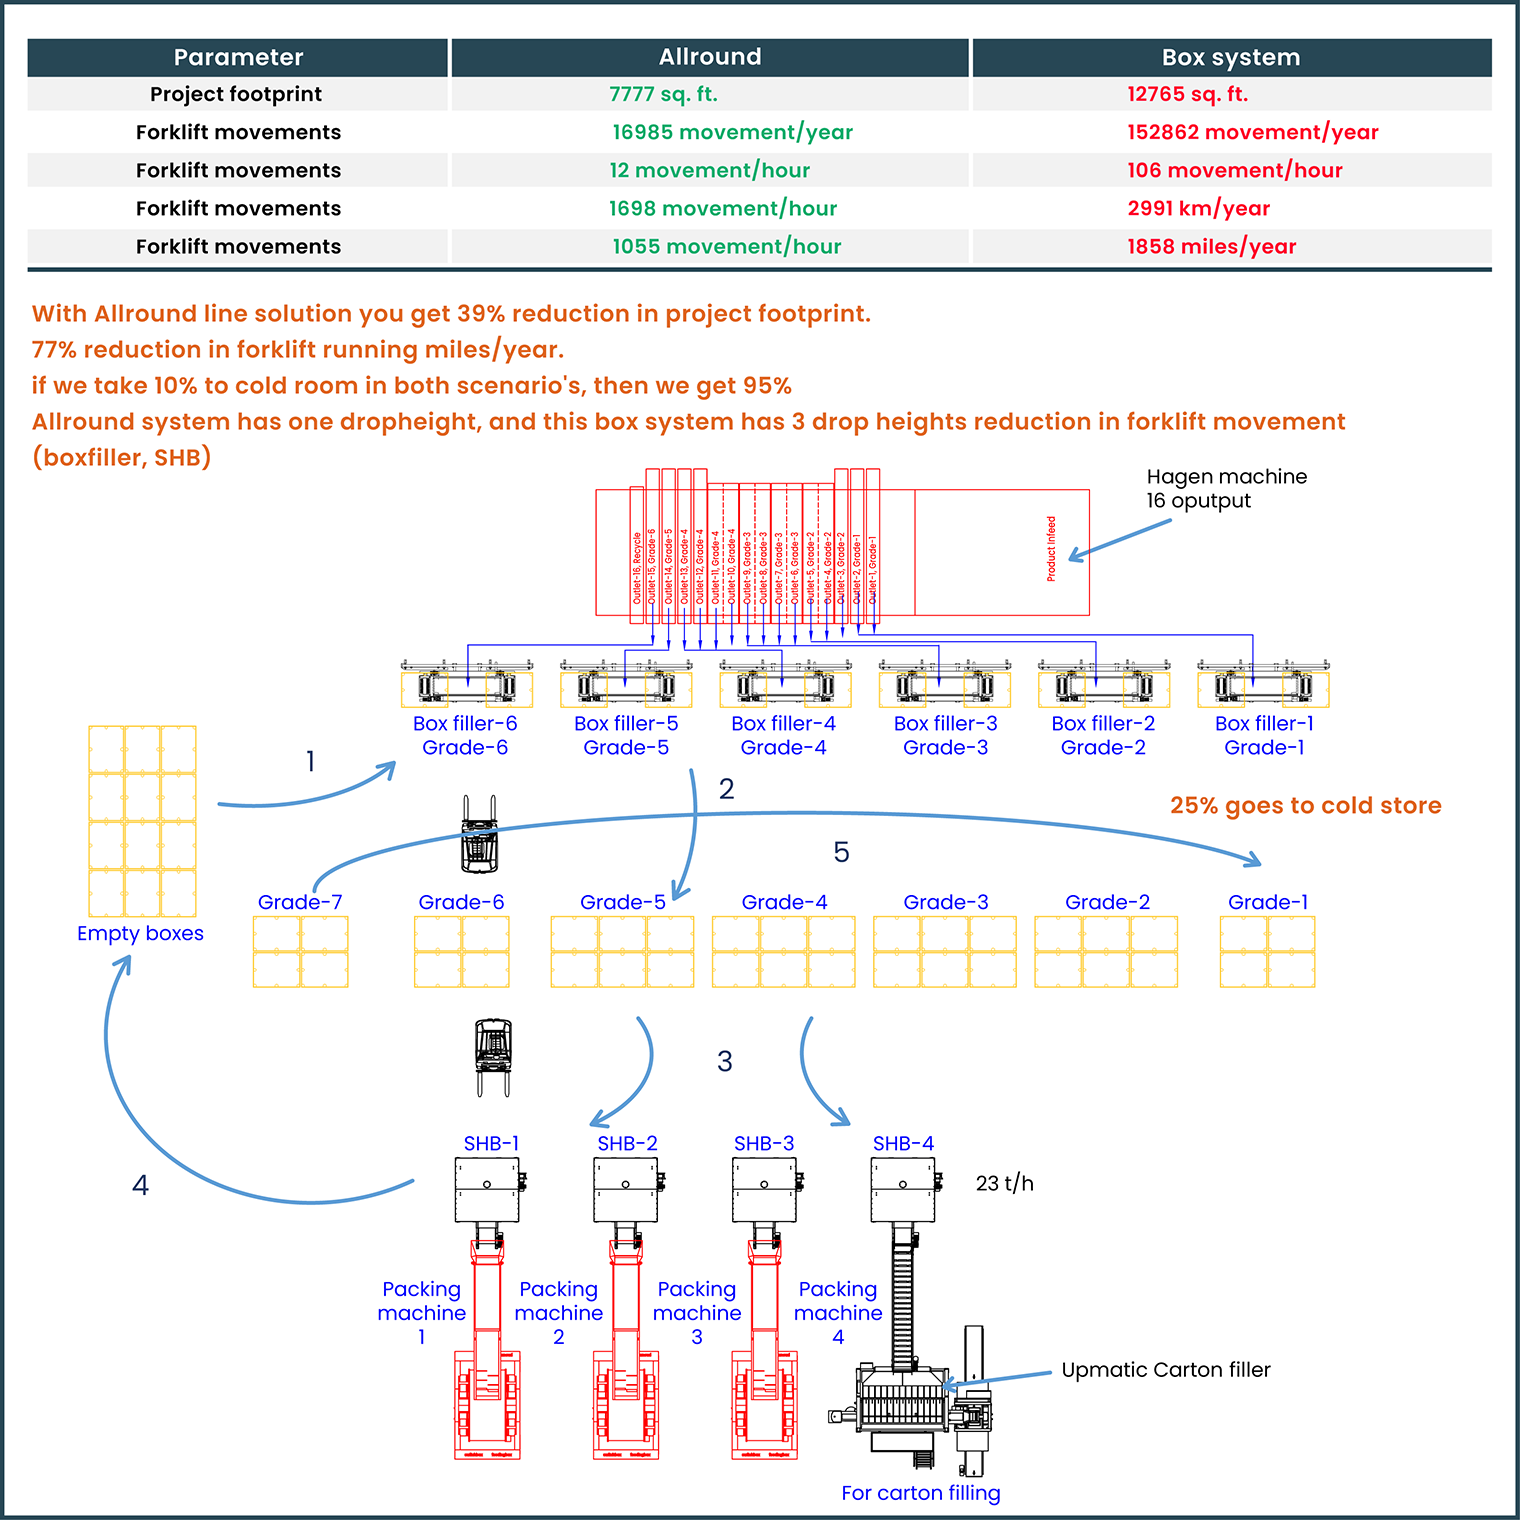
In this section of our calculation models, we analyze your current situation with regard to forklift and box movements as clearly as possible. We draw the current line as much as possible. If possible and necessary, we make a film and photos of your line and way of working. as mentioned earlier in the section on the site about labor saving, the forklift is our figurative enemy. We are going to calculate exactly how many miles each forklift travels per day. How many times do you have a particular box in the forklift. Where can we take the forklift out. This prevents extra drop heights. In the image next to this text you can see an outcome of such an approach. The differences are often astounding. For a pure calculation of the savings, you have to take into account a technical life of up toii and year for the installation.
Staffing
With Staffing we indicate the labor need for the line or project to function properly. We do not count the people in the office of planning and overhead. The numbers are all based on projects or on portions of those projects that we already realized and delivered. At one company or another, there will always be a difference in productivity. The numbers as specified in the calculations/drawings may not be reached with the line immediately after installation. However, you can use these numbers as a benchmark. Do we work efficiently? Is the way we work still up to date? A well-calculated schedule for labor needs is also an indispensable tool to make the right decision for any investment. Some investments may yield far too short labor savings to justify the purchase.
